- Getting Started
- GS-1) What is AutDB?
- GS-2) What are the new features of AutDB 2.0?
- GS-3) What types of information does AutDB 2.0 contain?
- GS-4) What is the gene classification rationale in AutDB 2.0?
- GS-5) How is AutDB 2.0 data organized?
- GS-6) How do I access data within AutDB 2.0?
- GS-7) How do I search AutDB 2.0 using Advanced Search?
- Human Gene Module
- HG-1) What information does the Human Gene module contain?
- HG-2) What new features of the Human Gene module are present in AutDB 2.0?
- HG-3) How do I enter the Human Gene database?
- HG-4) What do I see in the search result for the Human Gene module?
- HG-5) How do I view the detailed annotation of a candidate gene?
- HG-6) What do I see in the detailed annotation of candidate genes?
- HG-7) What do I see in the Summary tab of candidate genes?
- HG-8) What do I see in the Sequence Variants tab of candidate genes?
- HG-9) How is data within the Human Gene module linked to other modules of AutDB 2.0?
- HG-10) How do I edit/submit annotations to the Human Gene module?
- HG-11) How do I view documentation about the curation of data within the Human Gene module?
- HG-12) How do I view current statistics for data within the Human Gene module?
- Animal Model Module
- AM-1) What's New in Animal Model Module V2.0?
- AM-2) How do I view Animal Model module data?
- AM-3) How do I search data within the Animal Model module?
- AM-4) What do I see in the search result for the Animal Model module using Advanced Search?
- AM-5) What do I see in the detailed annotation of genetic animal models in AutDB?
- AM-6) What do I see in the detailed annotation of induced animal models in AutDB?
- AM-7) What do I see in the summary tab of genetic animal models in AutDB?
- AM-8) What do I see in the construct details tab of genetic animal models in AutDB?
- AM-9) What do I see in the phenotypic profile tab of genetic animal models in AutDB?
- AM-10) What do I see in the inducer summary tab of induced animal models in AutDB?
- AM-11) What do I see in the construct details tab of induced animal models in AutDB?
- AM-12) What do I see in the phenotypic profile tab of induced animal models in AutDB?
- AM-13) What is PhenoBase?
- PIN
- PIN-1) What information does the PIN module contain?
- PIN-2) What new features of the PIN module are present in AutDB 2.0?
- PIN-3) How do I enter the PIN database?
- PIN-4) What do I see in the search result for the PIN module?
- PIN-5) How do I view detailed annotation for protein interactions?
- PIN-6) What do I see in the detailed annotation of protein interactions?
- PIN-7) What do I see in the Interactome tab of protein interactions?
- PIN-8) What do I see in the Interaction Table tab of protein interactions?
- PIN-9) How do I view documentation about the data curated within the PIN module?
- PIN-10) How do I view current statistics for data within the PIN module?
- CNV
- CNV-1) What information does the CNV module contain?
- CNV-2) How do I enter the CNV database?
- CNV-3) What do I see in the search result for the CNV module?
- CNV-4) How do I view the detailed annotation of a CNV locus?
- CNV-5) What do I see in the detailed annotation of a CNV locus?
- CNV-6) What do I see in the CNV Summary tab?
- CNV-7) What do I see in the Population Data tab?
- CNV-8) What do I see in the Individual Data tab?
- CNV-9) What do I see in the Animal Model tab?
- CNV-10) How do I view documentation about the curation of data within the CNV module?
- CNV-11) How do I view current statistics for data within the CNV module?
- Workspace
- WS -1) What is WorkSpace?
- WS-2) How do I access Workspace?
- WS-3) How do I upload a file into Workspace?
- WS-4) How do I download a reference file from the AutDB 2.0?
- WS-5) How do I merge data between various files and Workspaces?
- WS-6) After all of the desired information input, how do I actually utilize Workspaces and information from the files?
- Citations
- Contact Us
|
|
| HELP Sign In |
GS-1) What is AutDB?
AutDB is a database built on information extracted from peer-reviewed scientific and clinical studies on the molecular genetics and biology of autism spectrum disorders (ASD).
AutDB‘s main feature is a comprehensive list of candidate genes associated with ASD. The candidate genes are richly annotated for their relevance to autism. The site also provides an in-depth, current view of each gene‘s molecular function.
AutDB is organized into interactive modules, which currently include Human Gene, Animal Model, Protein-Protein Interaction, and Copy Number Variant.


GS-2) What are the new features of AutDB 2.0?
AutDB 2.0 provides new bioinformatics features and functionalities envisioned to accelerate discoveries by the autism research community. In addition to expanding the scientific content, the user interface has been revamped to enhance usability.
The new scientific features include: expansion of the Human Gene module, additions to the Animal Model module, incorporation of a new Copy Number Variant module, and integration of a new Gene Scoring module.
The new website enhancements include: a new tab-based format that allows easier navigation between modules, a redesigned AutDB homepage with state-of-the-art technology, new module homepages featuring subnavigation bars with detailed documentation, and new timestamps that mark dataset updates for each module.
GS-3) What types of information does AutDB 2.0 contain?
AutDB integrates genetic, neurobiological, and clinical information about genes associated with ASD. AutDB‘s content is entirely based on the peer-reviewed scientific literature and is manually annotated by expert biologists. Data presented in abstracts or at conferences are not included.
The site‘s interactive modules connect information on candidate autism genes with research that illuminates their molecular functions in the brain.
Current modules include:
Human Gene. This is an active collection of candidate genes identified in genetic association studies, genes linked to syndromic autism, and rare single gene mutations. The last group is the most rapidly expanding group of genes.
Animal Model. This module includes details on the behavioral and anatomical characteristics of animal models of autism. It is organized using a dataset called PhenoBase that describes 16 broad categories relevant to the clinical presentation of autism.
Protein-Protein Interactions. This module describes all known molecular interactions of candidate genes for ASD. Each protein Interaction (PIN) is presented using a tab-based display of data, divided into “Interactome” and “Interaction Table” tabs, containing graphical and tabular views, respectively.
Copy Number Variant (CNV). This module serves as a comprehensive, up-to-date reference for all known copy number variants associated with ASD. Like other modules of AutDB, content of the CNV module originates entirely from published scientific literature.
GS-4) What is the gene classification rationale in AutDB 2.0?
Autism-related genes in AutDB are classified into four categories:
(1) rAut: This category applies to genes implicated in rare monogenic forms of ASD, such as SHANK3. The types of allelic variants within this class include rare polymorphisms and single gene disruptions/mutations directly linked to ASD. Submicroscopic deletions/duplications (copy number variations) encompassing single genes specific for ASD are also included.
(2) sAut: This category includes genes implicated in syndromic forms of autism, in which a subpopulation of patients with a specific genetic syndrome, such as Angelman syndrome or fragile X syndrome, develops symptoms of autism.
(3) iAut: This category is for small risk-conferring candidate genes with common polymorphisms that are identified from genetic association studies in idiopathic ASD, or autism of unknown cause, which makes up the majority of autism cases.
(4) fAut: This category lists functional candidates relevant for ASD biology, not covered by any of the other genetic categories. Examples include the gene CADSP2, in which knockout mouse models exhibit autistic characteristics, but the gene itself has not been directly tied to known cases of autism.
A gene can belong to more than one category, depending on the mutation. For instance, a common variant may confer risk for developing idiopathic autism but an inactivating mutation in the same gene places it in the higher risk-conferring categories. In such cases, all the appropriate categories are used to annotate the genes.
Both rAut and sAut categories represent monogenic forms of ASD. However, we include a distinct class for each because sAut genes have been linked to syndromic forms of autism, such as fragile X syndrome, whereas rAut genes are only potential candidates for autism. sAut genes are present in individuals whose ASD was diagnosed secondary to the main clinical features of their genetic disorder. In contrast, rAut genes are identified in the course of genetic screening of individuals diagnosed with ASD.
GS-5) How is AutDB 2.0 data organized?
A AutDB entry is the presentation of a gene linked to ASD along with all of the gene’s molecular, neurobiological, and clinical attributes. The steps involved in the curation of a AutDB entry are schematically shown in Figure GS-1.

Figure GS-1. Model for collection, annotation, storage, and visualization of candidate genes linked to ASD to create AutDB.
First, all reports pertaining to a candidate gene are extracted, counted for the number of studies, and collapsed under a single header representing the gene entry.
Second, multi-step annotations are carried out on a candidate gene to incorporate diverse molecular information and assess its relevance to ASD. These annotations include links to highly-cited and recently-published articles that present current knowledge about the molecular function of the candidate gene.
Third, these annotations are entered into the AutDB database to make them available to the public.
The new-and-improved organization of AutDB 2.0 uses a nested tabular formatting that allows the user to easily navigate between gene information, animal models, protein interactions, copy number variants, and gene scores. The overall organization of this information can be seen in Figure GS-2.
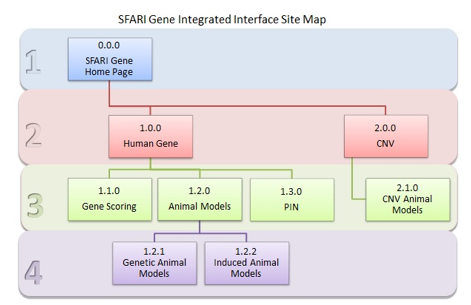
Figure GS-2. AutDB Site Map. This site map shows the organization of data modules within AutDB 2.0.
GS-6) How do I access data within AutDB 2.0?
Data can be accessed three ways using AutDB 2.0:
- You can use the Advanced Search function to access data (refer to question GS-7).
- You can access data via module homepages (refer to the target module in this User Guide)
- You can access data via the nested tabular structure found on each gene’s page (Figure GS-3)

Figure GS-3. Tab-Based Display of AutDB 2.0: Human Gene entry for SHANK3. Top: Tabs above the header box allow navigation between Gene, Gene Scoring, Animal Model, and PIN. Bottom: tab-based display of data, divided into “Summary” and “Sequence Variants” tabs.
GS-7) How do I search AutDB 2.0 using Advanced Search?
The Advanced Search can be found under the Tools menu on the left-hand side of the screen. If you click Advanced Search, you will be taken to an interactive “Search AutDB” box.
As shown in Figures GS-4 and GS-5, you can specify a number of search parameters by clicking on the drop-down menus within the search box.
“Select a DataSet” is the first drop-down menu and allows you to select the type of module you want to search: Human Gene or Animal Model.
“Search fields for” is the second drop-down menu and lets you choose the type of query within the selected module. For Human Gene, these search fields include Gene Symbol, Gene Name, Chromosome Number, Chromosome Band, and Text. For Animal Model, there is an additional drop-down menu titled “Model Type” that allows you to select Genetic or Induced. In the Genetic model type, you can search by Gene Symbol, Gene Name, and Pheno Category. In the Induced model type, you can search by Inducer Name and Pheno Category.
Next, enter the appropriate query term/phrase into the empty text window of the search box and click the “Submit Query” button.

Figure GS-4. AutDB search box for Human Gene module.
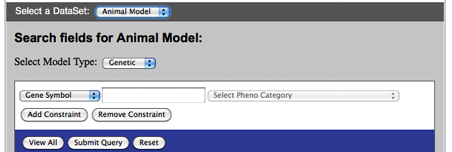
Figure GS-5. AutDB search box for Animal Model module.
HG-1) What information does the Human Gene module contain?
The Human Gene module is an active collection of candidate genes identified through genetic association studies. It includes genes linked to syndromic autism as well as genes that harbor rare mutations linked to autism.
HG-2) What new features of the Human Gene module are present in AutDB 2.0?
Several new features and functionalities were added to V2.0:
- Human Gene Home page (http://174.79.186.155/autdb/HG_Home.do)
The Human Gene module was refined to now include a home page, which provides users with information about the module, module terminology, and module structure. A brief set of statistics is also provided at the bottom of the home page.
The window in the middle of the Human Gene home page contains two rotating graphics that each have a link that allows you to ‘Explore Human Genes’ and thereby view the dataset directly. The second rotating image, an ideogram showing all human chromosomes (shown in the image directly below), also allows you to click an individual chromosome to pull up data solely for genes on that chromosome.

Figure HG-1. The Human Gene Module homepage
This home page has several tabs that link to sub-pages as follows (See Figure HG-1):
- Human Home (links back to the home page)
- About (links to a text page that gives some history of the module and generally describes the information that can be found in the Human Gene module)
- Curation (links to a text page that describes how the data was obtained and curated),
- Evidence (links to a text page that describes in more detail the types of information that you will find in the database), and
- Statistics (links to a page with statistics concerning the data in the Human Gene module).
In a sidebar on the right side of The Human Gene home page, you will find links to the home pages of the other modules in addition to links to tools. This sidebar persists across all pages within AutDB/AutDB to provide easy navigation for the user.
2.Search & Display
The search and individual gene pages in the Human Gene module v2.0 were refined to have a new, integrated tab-based display that allows for easy navigation across different modules. Tabs include Gene Scoring (A SFARI Initiative), Animal Models, and Protein-Protein Interactions.
This tab-based architecture extends to the display of the Summary information for the gene, which includes a brief summary of the evidence linking the gene to ASD, text that describes the gene’s molecular function, and links to external resources such as Entrez Gene, Uniprot, and Gene Cards, as well as reference information.
The Sequence Variants tab contains two sub-headers, Rare and Common. The Rare sub-navigation tab contains three new columns (Inheritance Pattern, Inheritance Association and Family Type), in addition to detailed information such as variant type, allele change and residue change. The Common sub-navigation tab contains two new columns (Population Origin and Population Stage), in addition to detailed information such as SNP ID, allele change and residue change.
3. Expansion of Annotation
A column with links to the PubMed abstracts has been added to both the Rare and Common Sequence Variation tables so that mutation entries are linked with their corresponding PMIDs. In addition, a unique ID (called the Variant ID) is given to each variant listed.
HG-3) How do I enter the Human Gene database?
The Human Gene module can be entered a number of ways. One way is by clicking the ‘Human Gene’ Quick Link on the left-hand side of the AutDB Home Page. A second way is by clicking the Human Gene icon (Figure HG-2) on the AutDB Home Page:

Figure HG-2. The Human Gene icon on the AutDB Home Page
Finally, clicking the ‘Explore Human Gene’ button on the ideogram of the human chromosomes will take you to the full list of human genes in a tabular format. Clicking individual chromosomes in the ideogram will also take you to a tabular list of human genes on that particular chromosome.
HG-4) What do I see in the search result for the Human Gene module?
Let’s take the example of searching for ASD candidate genes on Chromosome 16. AutDB will retrieve a comprehensive list of ASD candidate genes on that chromosome in a tabular format (Figure HG-3). The list will consist of candidates reported from genetic association studies, including rare single gene mutations, genes linked to syndromic autism, and functional candidates.
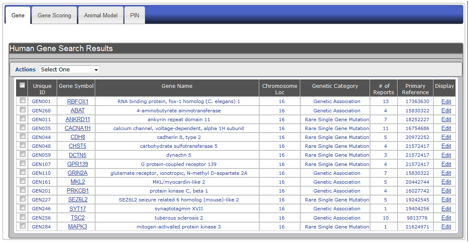
Figure HG-3. Display of search results using the example of ASD-associated genes on Chromosome 16. Search results appear in a summary row format showing: (A) unique ID, (B) gene symbol, (C) gene name, (D) chromosomal location, (E) genetic category, (F) number of autism-specific studies, (G) primary PubMed reference, and (H) a display option where you can edit information for a particular gene.
HG-5) How do I view the detailed annotation of a candidate gene?
Clicking a gene symbol in the search result table (see Figure HG-4) will take you to the detailed annotation page for that gene. 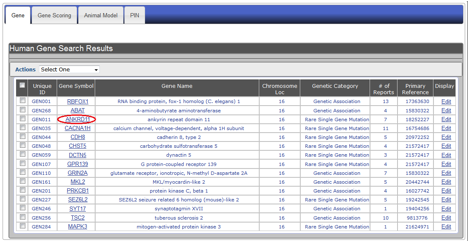
Figure HG-4. To view the detailed annotation of a candidate gene from the summary line display, click the gene symbol. In this example, the ANKRD11 link is outlined in red.
HG-6) What do I see in the detailed annotation of candidate genes?
Clicking a gene symbol in the search result table (see Figure HG-4) will take you to the detailed annotation page for that gene.
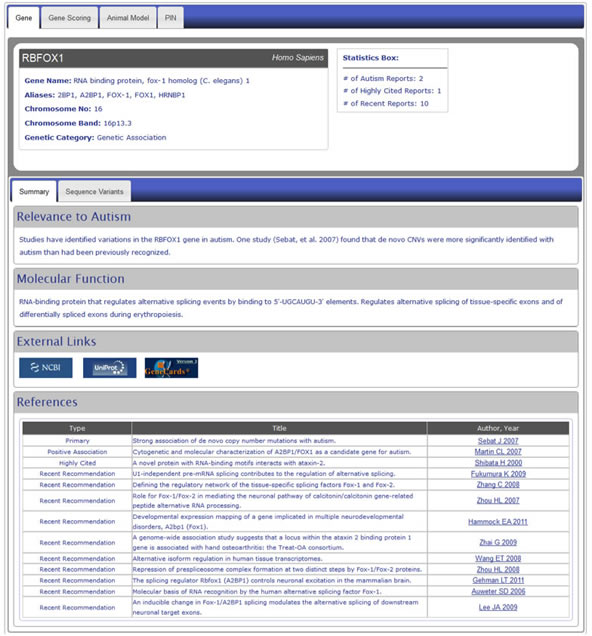
Figure 6. Detail level display of a Human Gene module entry using the example of the gene RBFOX1. Detailed annotations include general information about the gene, its relevance to autism, its molecular function and references to scientific publications concerning the gene and its relationship to autism. We also provide links to major external databases such as Entrez Gene, UniProt and GeneCards as well as to the PubMed abstracts of the reference articles.
HG-7) What do I see in the Summary tab of candidate genes?
In the Summary tab, you’ll see four sections that provide an overview of the gene (see Figure HG-5):
Relevance to autism this section summarizes the scientific report information that connects the gene to ASD.
Molecular Function - this section describes the molecular details of the gene and protein.
External Links - This section provides links to major external databases such as Entrez Gene (http://www.ncbi.nlm.nih.gov/sites/entrez), UniProt (http://www.uniprot.org/) and GeneCards (http://www.genecards.org/).
References - this section includes citations for the support studies connecting the gene to ASD (“Primary”, “Positive Association”, “Negative Association” and “Support”). To provide a global view of the gene/protein function, we also include references that are frequently cited (“Highly Cited”) and recent studies that reveal interesting details about the gene/protein (“Recent Recommendation”). These articles are not necessarily limited to the field of autism research. We also include links to the PubMed abstracts of the reference articles.
HG-8) What do I see in the Sequence Variants tab of candidate genes?
In the Sequence Variants tab, you’ll see a detailed table of the rare (top header) and common (bottom header) variants for that particular gene. Not all genes will have rare and/or common variants.
Under the rare header, you’ll see the following columns of information about each variant: Variant ID, Variant Type, Allele Change, Residue Change, Inheritance Pattern, Inheritance Association, Family Type, and the first author and year of the reference for the scientific publication containing that variant. This last column also includes a link to the PubMed abstract for that publication.
Under the common header, you’ll see the following columns of information about each variant: Variant ID, Polymorphism, SNP ID, Allele Change, Residue Change, Population Origin, Population Stage, and the first author and year of the reference for the scientific publication containing that variant. This last column also includes a link to the PubMed abstract for that publication.
HG-9) How is data within the Human Gene module linked to other modules of AutDB 2.0?
The Human Gene module is linked to the other modules of AutDB 2.0 by a tab-based format. Above either the search table display (Figure HG-4) or detail level display (Figure HG-6), you’ll see four tabs: Gene, Gene Scoring, Animal Model and PIN. Clicking on any of these tabs will take you to the corresponding information for that gene or those set of genes in each of those modules. For example, in Figure HG-4, clicking on the PIN tab will take you to a search table with all genes on chromosome 16 for which there is protein-protein interaction data.
HG-10) How do I edit/submit annotations to the Human Gene module?
NOTE: Registration with AutDB is required to access the edit module.
The "Submit New Gene" and "Edit" functions of AutDB let a registered user edit or add new annotations to an existing gene entry. You’ll find the "Submit New Gene" link under ‘Tools’ on the left-hand menu of AutDB. The "Edit" link is located in the summary row display of a gene entry (Figure HG-6, panel A).
This option brings up a submission window where you can add annotations (Figure HG-6, panel B), which are sent to a MindSpec moderator for approval. Upon approval, the new annotations will be displayed under the appropriate category for that gene entry (Figure HG-6, panel C).
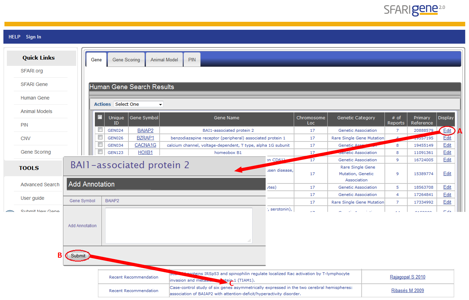
Figure HG-6. Editing a gene entry in AutDB using the example of the gene BAIAP2. Summary row display using the example of a candidate gene with a genetic association with autism, BAIAP2 or BAI1-associated protein 2. You can submit new annotations by selecting ‘Edit’ (A). Clicking ‘Edit’ brings up a new page where the annotation can be added (B). In this example, PubMed identifiers of two recently-published articles on BAIAP2 are submitted as new annotations. After editing an entry, the new annotations can be viewed within the “Recent Recommendation” category in the detailed display of the AutDB entry (C).
HG-11) How do I view documentation about the curation of data within the Human Gene module?
You can find information on data curation for the Human Gene module by clicking the ‘Curation’ sub-navigation tab on the Human Gene home page (Figure HG-7).

Figure HG-7. The ‘Curation’ sub-navigation tab on the Human Gene home page.
HG-12) How do I view current statistics for data within the Human Gene module?
You can view current statistics for the Human Gene module by clicking the ‘Statistics’ sub-navigation tab on the Human Gene home page (Figure HG-8).
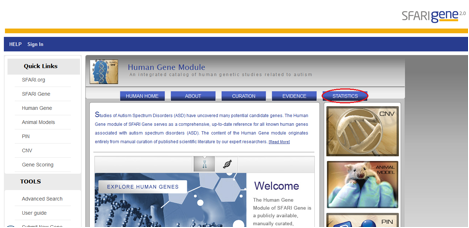
Figure HG-8. The ‘Statistics’ sub-navigation tab on the Human Gene home page.
AM-1) What’s New in Animal Model Module V2.0?
Version 2.0 for the Animal Model module introduces new features and refinements that aim to provide added functionality to the users (see Figure AM-1):
- Animal Model Home Page
The new Animal Model module home page serves as a landing point for users and introduces the module.
- Integrated Interface
The updated Animal Model module contains a tab-based interface that enables easy navigation to other AutDB modules.
- Collection of induced models
The Animal Model module now includes animal models in which an ASD phenotype was generated using an external factor to the model.
- Search & Display
In the updated Animal Model module, users can search for both genetic and induced animal models. Additionally, the tab-based structure display throughout the module unifies each separate module function.
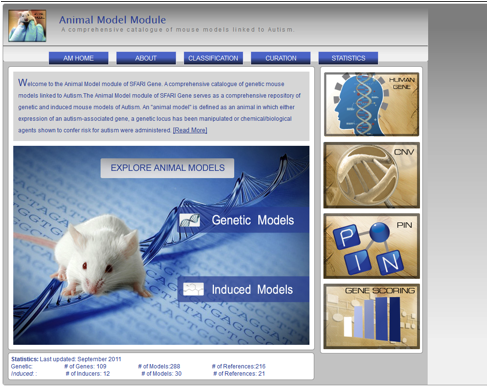
Figure AM-1: Animal Model Home Page provides a place for users to navigate to the models as well as the other modules within AutDB. The sub-navigation tabs include an a) About tab which provides introduction to the module, b) Classification tab which provides information about how the models are named, c) Curation tab which includes information about how the models are curated, and d) Statistics.
AM-2) How do I view Animal Model module data?
You can access the Animal Model module data in three ways:
1. You can access animal model data by entering the Animal Model module home and clicking on the links for either the Genetic or Induced models (Figure AM-2).
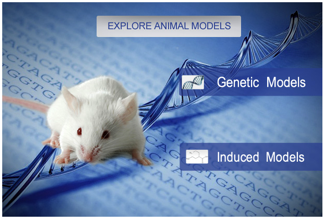
Figure AM-2a: Animal Model module home page featuring links to explore either the Genetic or Induced models.
2. You can also view animal model data from the Advanced Search menu by selecting ‘View All’ or searching for a particular entry (Figure AM-3).

Figure AM-2b: Advanced search menu for Animal Model data featuring ‘View All’ button and search entry boxes.
3. Finally, you can view animal model data by clicking the “Animal Model” tab above the detailed annotation of candidate genes, as shown for the gene RBFOX1 (Fig AM-4).

Figure AM-2c: Tab-Based Display of AutDB 2.0: Animal Model entry for Rbfox1
AM-3) How do I search data within the Animal Model module?
You can search data within the Animal Model in two ways:
-
If you want to search data within the Animal Model module using the Advance Search function, select “Animal Model” from the “Select a DataSet” drop-down menu (Figure AM-5).

Figure AM-3a. The “Select a DataSet” drop-down menu
After selection of Animal Model dataset, the second drop-down menu will be ”Select Model Type,” which allows you to select the type of model – Genetic or Induced (Figure AM-6).
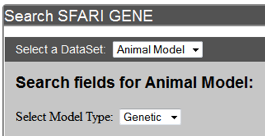
Figure AM-3b. Select a Model Type drop-down menu
You will then be able to choose the type of query within the selected model type using the “Search fields for Animal Model.” (Figure AM-7)

Figure AM-3c: Search fields for Genetic Animal Models include: Gene Symbol, Gene Name, and Pheno Category.

Figure AM-3d: Search fields for Induced Animal models include: Inducer Name and Pheno Category.
Next, enter the appropriate query term/phrase into the empty text window of the search box and click the “Submit Query” button (Figure AM-8).
-
If you access the Animal Model module data from the “Genetic Models” or “Induced Models” links on the Animal Model module homepage, you can search the animal model data by clicking on the Gene Symbol or Inducer Name, respectively.
AM-4) What do I see in the search result for the Animal Model module using Advanced Search?
Searching for genetic animal models with the gene name "neuroligin" will retrieve a list of animal models in a table format under the Animal Model tab. Example of this display is shown in Figure AM-10.
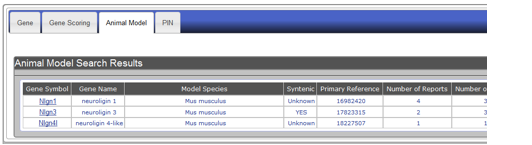
Figure AM-4a: Display of search results using the example of mouse gene name Neuroligin. Search results appear in a summary table format showing: (A) Gene Symbol, (B) Gene Name, (C) Model Species, (D) Syntenic (two or more genes located on the same chromosome), (E) Primary Reference, (F) Number of Reports, and (G) Number of Models.
Searching for induced animal models with the inducer name "thalidomide" will retrieve a list of animal models under a table format. Example of this display is shown in Figure AM-11.
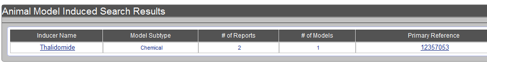
Figure AM-4b: Display of search results using the example of inducer Thalidomide. Search results appear in a summary table format showing: (A) Inducer Name, (B) Model Subtype (Chemical or Biological), (C) Number of Reports, (D) Number of Models, and (E) Primary Reference.
AM-5) What do I see in the detailed annotation of genetic animal models in AutDB?
To view the detailed annotation of a genetic animal model, select the gene symbol from the search results table. Detailed annotation is displayed using a tab-based interface, with the information divided across three tabs – gene summary, construct details, and phenotypic profile. Each tab level includes header containing gene identification information and statistics, as shown in Figure AM-12.
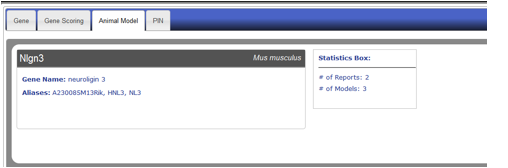
Figure AM-5: Detail level display for Neuroligin 3. Each entry data is divided across three tabs with information header which includes the Gene Symbol, Model Species, Gene Name, aliases, and brief statistics – Total number of reports and total number of models.
AM-6) What do I see in the detailed annotation of induced animal models in AutDB?
To view the detailed annotation of an induced animal model, select the inducer symbol from the search results table. Detailed annotation is displayed using a tab-based interface, with the information divided across three tabs – summary, construct details, and phenotypic profile. Each tab level includes a header containing inducer identification information and statistics, as shown in Figure AM-13.

Figure AM-6: Detail level display for Thalidomide. Each entry data is divided across three tabs with information header which includes the Inducer name, Inducer abbreviation, Model Subtype (Chemical/Biological), Model Species, link to external database, PubChem, and finally brief statistics about the number of reports and number of models.
AM-7) What do I see in the summary tab of genetic animal models in AutDB?
The first tab of the detailed annotation of genetic models is the summary tab, which includes the following information: Model summary information, external links, and references, as shown in Figure AM-14.

Figure AM-7: Detail level display for Neuroligin 3 (Summary tab). Each entry is displayed in a detail level across three tabs. The first tab, “Summary,” includes a brief summary of the model. It also includes clickable links to external databases, such as Allen Brain Atlas, Mosue Genome Informatics, and Entrez Gene and a list of references describing models for the selected entry along with the report type (Primary or Additional)
AM-8) What do I see in the construct details tab of genetic animal models in AutDB?
The second tab of the detailed annotation view of genetic models is the construct details tab, which includes a list of models of the gene along with construct information for all the models listed as shown in Figure AM-15. You can access the construct information by clicking on a model name to expand.

Figure AM-8: Detail level display for Neuroligin 3 (Construct Details tab). Each entry is displayed in a detail level across three tabs. The second tab, Construct Details lists all the models for a particular entry along with detailed information about the construct of the model like: Model Type, Model Genotype, Mutation information, Allele Type, Strain of Origin, Genetic Background of model, ES Cell Line, Mutant ES Cell Line and Model Source. Each model name can be clicked on to expand entry and view the construct information.
AM-9) What do I see in the phenotypic profile tab of genetic animal models in AutDB?
The last tab of the detailed annotation view of genetic models in the phenotypic profile tab includes detailed phenotypic information for all the models of a particular gene. The phenotypic information is displayed using an entity-quantity (EQ) classification system, which describes the phenotype using standardized vocabulary.
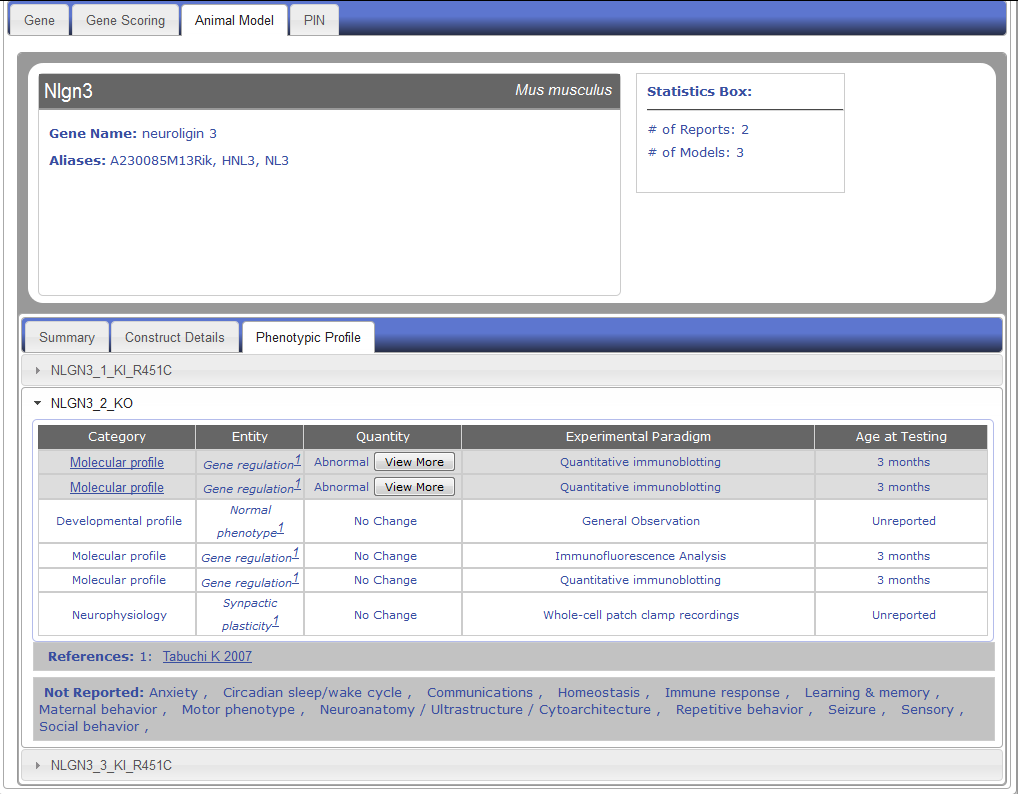
Figure AM-9.1a: Detail level display for Nlgn3 (Phenotypic Profile Tab). Each entry is displayed in a detail level across three tabs. The last tab, Phenotypic Profile, lists all the models for a particular entry along with all the phenotypes listed in report, including ‘No Change’ entries. The phenotype change is described in the Quantity column using standardized vocabulary (Increased, Decreased, Abnormal), and the Entity column describes the phenotype being observed. Each entity is classified into one of sixteen categories described in PhenoBase. Each entry also includes a ‘View More’ button to display detailed description of change in phenotype and paradigm used to explore phenotype. Experimental Paradigm and Age of Testing information are also listed.
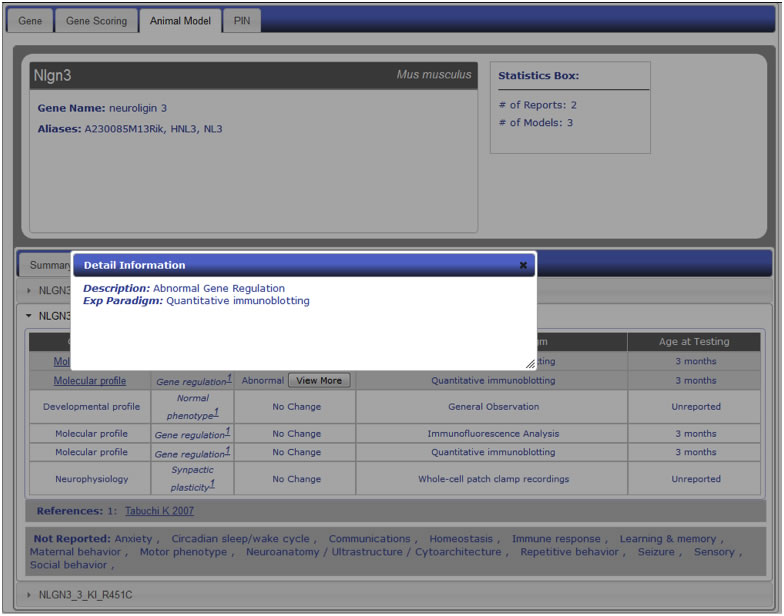
Figure AM-9.1b: Detail Information for entry within Phenotypic Profile. Shown here is an example description of a change in the Gene Regulation entry under the Molecular profile phenotype category. Information includes detailed description of actual change in phenotype along with more detailed experimental paradigm.
AM-10) What do I see in the inducer summary tab of induced animal models in AutDB?
The first tab of the detailed annotation of induced models is the summary tab which includes the following information: Model summary, Human Clinical Evidence, Exposure, Mode of Action, Usage, and References, as shown in Figure AM-16.

Figure AM-10: Detail level display for Thalidomide ( Inducing Factor tab). Each entry is displayed in a detail level across three tabs. The first tab, Inducing Factor, includes a brief summary of the model and evidence linking the inducer to autism in humans. The Inducing Factor tab also contains links to references, medium of exposure in humans, mode of action in humans (if any), usage of inducer, and a list of references describing models for the selected entry along with the report type (Primary or Additional)
AM-11) What do I see in the construct details tab of induced animal models in AutDB
The second tab of the detailed annotation view of induced models is the construct details tab which includes a list of models of the gene along with construct information for each model.
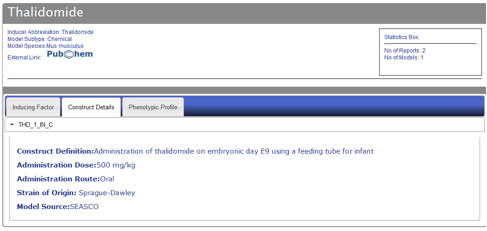
Figure AM-11: Detail level display for Thalidomide (Construct Details tab). Each entry is displayed in a detail level across three tabs. The second tab, Construct Details, lists all the models for a particular entry along with detailed information about the construct of the model, including: Text describing construct definition, administration dose of inducer, administration route, strain of origin of model animal, and finally model source. Each model name can be clicked to expand the entry and view the construct information.
AM-12) What do I see in the phenotypic profile tab of induced animal models in AutDB?
The last tab of the detailed annotation view of genetic models is the phenotypic profile tab, which includes detailed phenotypic information for all the models of a particular gene. The phenotypic information is displayed using an entity-quantity (EQ) classification system which describes the phenotype using standardized vocabulary.
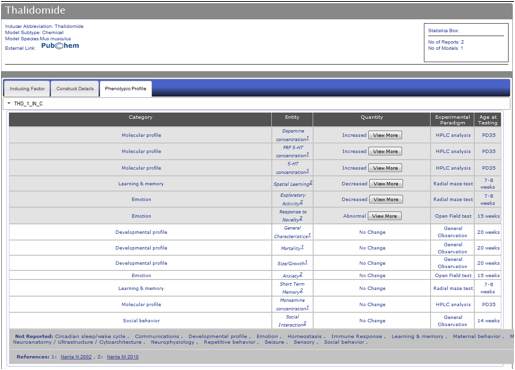
Figure AM-12a: Detail level display for Thalidomide (Phenotypic Profile Tab). Each entry is displayed in a detail level across three tabs. The last tab, Phenotypic Profile, lists all the models for a particular entry along with all the phenotypes listed in report, including ‘No Change’ entries. The phenotype change is described in the Quantity column using standardized vocabulary (Increased, Decreased, Abnormal), and the Entity column describes the phenotype being observed. Each entity is classified into one of sixteen categories described in PhenoBase. Each entry also includes a ‘View More’ button to display detailed description of change in phenotype and paradigm used to explore phenotype. Experimental Paradigm and Age of Testing information are also listed.
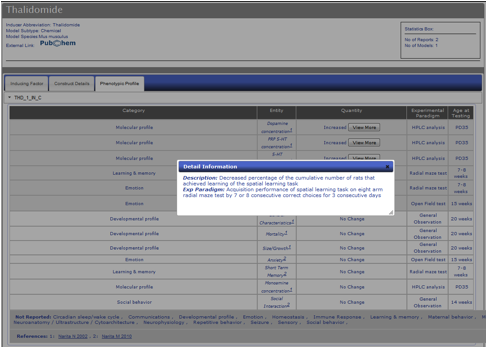
Figure AM-12b: Detail Information for entry within Phenotypic Profile. Shown here is an example description of a change in the Spatial Learning entry under Learning & Memory phenotype category. Information includes detailed description of actual change in phenotype along with more detailed experimental paradigm.
AM-13) What is PhenoBase?
PhenoBase is a key component of the Animal Model module. This dataset contains a list of more than 100 standardized phenotype terms and characteristics of the animal models for 16 categories relevant to the clinical presentation of autism. PhenoBase describes the presentation of the core behaviors of autism – such as repetitive behavior or learning and memory – in each of the animal models, along with their physiological and molecular characteristics.

Figure AM-13.1: PhenoBase Table View. Shown here is a sample view of the Social Behavior PhenoBase table which can be accessed by selecting the category name from the Phenotypic Profile tab. The table includes the following information: Phenotype Terms, Phenotype Definition, ASD Domain, and Experimental Paradigm.
PIN-1) What information does the PIN module contain?
The Protein Interaction (PIN) module of AutDB 2.0 serves as a comprehensive, up-to-date reference for all known direct protein interactions of genes associated with autism spectrum disorders (ASD). It includes six major types of interactions: protein binding, RNA binding, promoter binding, protein modification, autoregulation, and direct regulation. Each protein interaction is manually curated from primary reference articles after consultation with public databases (BioGRID, HPRD, PubMed) and commercial resources (Pathway Studio 7.1).
The PIN module is envisioned to act as a bioinformatics platform for network biology analysis of molecular pathways underlying ASD pathogenesis.
PIN-2) What new features of the PIN module are present in AutDB 2.0?
First released in June 2011, the PIN module has now been incorporated into the tab-based display of AutDB 2.0. At the primary level, a summary of PIN search results is presented under a tab from which users can easily navigate to corresponding data in tabs for "Gene," "Gene Scoring," and "Animal Model" modules. At the secondary level, detailed PIN annotation for autism candidate genes is incorporated into a tab-based display for both graphical and tabular views of protein interactomes.
PIN-3) How do I enter the PIN database?
You can access PIN data by one of three ways:
-
AutDB home page: Click on the “Protein Interactions” button in the pentagon-shaped image (Figure 1). This will take you to the PIN home page, where you can enter the database by clicking on the “Explore Protein Interactions” button in the center of the slideshow (Figure 1, arrow A).
-
“Quick Links” menu: Select “PIN” (Figure PN-1, arrow B). This will take you to the PIN home page, where you can enter the database by clicking on the “Explore Protein Interactions” button in the center of the slideshow (Figure PN-1, arrow A).
-
“Tools” menu: Click on the “Advanced Search” link (Figure PN-1, arrow C). This will take you to a “Search AutDB” page, from which you should click on the “Select a Dataset” drop-down menu and select “PIN.” You can then either browse the PIN dataset by selecting “View All” or search the PIN dataset by selecting one of three criteria (gene symbol, gene name, interaction type) and selecting “Submit Query” (Figure PN-2). If users choose to search by gene symbol or gene name, they must enter text within the search box. If users choose to search by interaction type, they must choose the interaction type from the corresponding drop-down menu.
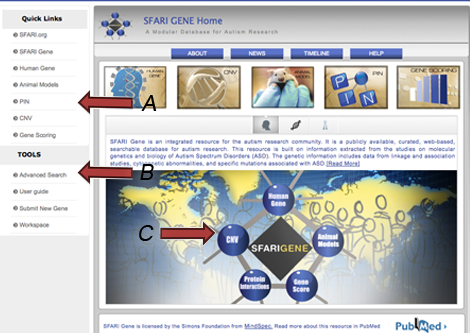
Figure PN-1. The AutDB home page features three ways to enter the PIN database.

Figure PN-2. PIN Search Page of AutDB.
PIN-4) What do I see in the search result for the PIN module?
When you browse or search for a gene using the PIN module, you will first encounter a summary row format showing the Gene Symbol, Gene Name, Number of Interactions, and links to the corresponding entries in the Human Gene and Animal Model modules of AutDB (if available). To reach the secondary level of display (the “Detail” level), you should click on the desired gene symbol.
An example of a search result in the PIN module is illustrated in Figure PN-3. (Note: If you search by Interaction Type, the “No. of Interactions” column will only reflect the number of interactions corresponding to the interaction type of interest.)

Figure PN-3. PIN Search Result for NRXN1
PIN-5) How do I view detailed annotation for protein interactions?
To view detailed PIN annotation for an autism candidate gene, click on the gene symbol of interest in the PIN search results.
PIN-6) What do I see in the detailed annotation of protein interactions?
The PIN detailed annotation page illustrates two main sections:
1) Header: (Figure PN-4)
This section summarizes information of the PIN entry. The left corner summarizes the gene of interest with information pertaining to its Homo sapiens sequence, including its gene symbol, gene name, gene aliases, and external links to its corresponding entries in the public databases BioGRID and HPRD. The right corner contains information related to the PIN entry, including internal links to its corresponding entries in the Human Gene and Animal Model modules of AutDB and the summary statistics for the gene of interest including total interactions and total publications.
2) Tab-Based Display of PIN Interactome:
This section features two views of protein interactomes:
- “Interactome” graphical view (see Question PIN-7)
- “Interaction Table” tabular view (see Question PIN-7)

Figure PN-4. PIN Detailed Annotation Entry for NRXN1: Header.
PIN-7) What do I see in the Interactome tab of protein interactions?
The “Interactome” tab features the graphical view of the protein interactome (Figure PN-5). It presents an interactive slideshow which cycles through three views: full interaction, full interaction with autism candidate genes highlighted, and interactions between ASD-linked genes (Figure PN-6), all generated using Cytoscape. On the right side, we show that ASD-linked genes are represented in the interactomes by red circles. Below that is situated a legend for the tabular interactome containing the types of protein interactions included with the PIN dataset: Protein Binding, RNA Binding, Promoter Binding, Protein Modification, Direct Regulation, and Autoregulation.

Figure PN-5. PIN Detailed Annotation: “Interactome” tab shows graphical view of protein interactome

![]()

![]()

Figure PN-6. Expanded View of Interactome Slideshow for NRXN1.
PIN-8) What do I see in the Interaction Table tab of protein interactions?
The “Interaction Table” tab features the tabular view of the protein interactome (Figure PN-7). It includes the interactor’s gene symbol, gene name, species, Entrez Gene ID, UniProt ID, interaction type (represented by legend in middle section of page), evidence, and reference. Columns for interaction type, evidence, and reference are hyperlinked such that users can click on the image/text to obtain definitions of those entries in the form of Metadata Tables (see Question PIN-9).
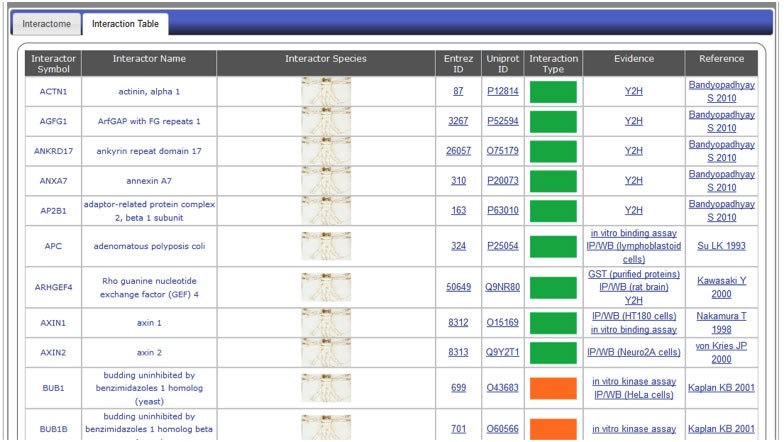
Figure PN-7. PIN Detailed Annotation: "Interaction Table" tab shows tabular view of protein interactome
PIN-9) How do I view documentation about the data curated within the PIN module?
Descriptions of PIN data content can be viewed in two ways:
-
Subnavigation tabs of the PIN home page (Figure PN-8)
These include the following tabs: About, Curation, Interaction, Evidence, Statistics
-
Metadata tables (Figures PN-9-11)
If you wish to obtain further information regarding an interactor’s species, evidence, or interaction type,” select the corresponding entry within the desired column of interest. You will then be presented with an abbreviated table of defining one of these three categories.
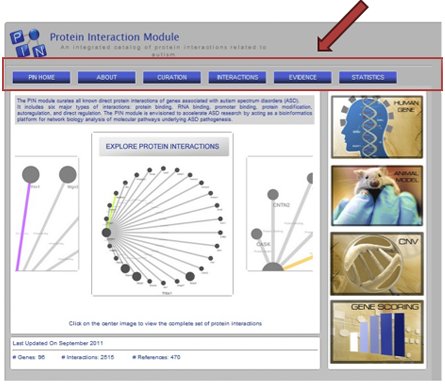
Figure PN-8. PIN Home Page of AutDB 2.0.

Figure PN-9. Metadata Table for Species of NRXN interactor APBA2.

Figure PN-10. Metadata Table for Evidence of NRXN interactor APBA2.

Figure PN-11. Metadata Table for Interaction Type of NRXN interactor APBA2.
PIN-10) How do I view current statistics for data within the PIN module?
Statistics for PIN data content are present in two sections of the PIN home page:
-
Bottom margin - Here you will find abbreviated statistics, marked with a time stamp.
-
“Statistics” subnavigation tab - Here you will find full statistics, accompanied by corresponding graphs and marked with a time stamp.
CNV-1) What information does the CNV module contain?
The CNV module of AutDB is a comprehensive, up-to-date collection of all copy number variants associated with autism spectrum disorders (ASD). As with the other modules of AutDB, the content of the CNV module originates entirely from published scientific literature. MindSpec researchers systematically search, collect, and extract information on CNVs from autistic case cohorts and, when available, unaffected control cohorts. CNVs in the module are organized based upon the locus (chromosomal region or band) in which they were observed in each annotated report.
When available, the following information on both case and control cohorts is extracted and presented in the CNV module as population data:
Description. A brief synopsis of the cohort, including the source of the individuals within the cohort.
Cohort size. Case and control cohorts come in a wide range of sizes. Case cohorts of smaller sizes frequently provide more information on the phenotypic characteristics of affected individuals within the cohort, but are of less significance in statistically determining the pathogenic relevance of a CNV at a given locus across populations. On the other hand, larger case cohorts are more useful in statistically determining pathogenic CNV relevance, but typically they provide far less information on the phenotypic characteristics of affected individuals.
Diagnosis. Oftentimes, the diagnosis criteria (ADI-R, ADOS, etc.) is described, as is the number of individuals with specific primary diagnoses, such as autism, Asperger's syndrome, or PDD-NOS.
Age, Gender, and Geographical Ancestry. The age of a cohort is typically given as either a range of ages or a mean age. Males are diagnosed with ASD approximately 3x more than females. As such, large autistic case cohorts are typically designed to reflect this disparity, with roughly 70-85% of individuals within a case cohort being male. Control cohorts, on the other hand, are typically 50% male. The majority of cohorts are predominantly of Caucasian/European origin. As such, determining the pathogenic relevance of a CNV at a given locus across ethnic groups is difficult.
Methodology. Population data includes the methodology used to discover CNVs at the locus of interest and, in some cases, the methodology used to independently confirm or validate the CNV.
Many published reports in which copy number variants have been identified include information on the individuals (also referred to as cases or probands) within autistic populations. When provided, this information is curated and presented in the individual data section.
Case studies commonly feature detailed profiles on affected individuals from which we extract information to form the following categories:
Clinical and cognitive profile. These categories can potentially contain a broad range of information, depending on the source material. Among the types of information included in the clinical profile category are : clinical history; dysmorphic features; comorbidities commonly associated with ASD such as ADHD, epilepsy, or sleep disturbances; and growth parameters such as height, weight, and head circumference. When included in the published report, ADI-R and/or ADOS scores are listed. Otherwise, more qualitative measures of core ASD features (deficiencies in social interactions, communication deficits, and repetitive and restricted behaviors) are provided.
With regards to the cognitive profile, individuals with ASDs often exhibit a range of intellectual deficits. Information on IQ scores, or the extent of mental retardation, intellectual disability, or developmental delay is provided in this category. Cognitive profile may either be qualitative ("average", "below-average", etc.) or quantitative (with numerical score or percentile values), and in some cases the testing metholodogy is provided.
CNV Inheritance. A CNV can either arise de novo or be inherited on either the maternal chromosome or the paternal chromosome (although, in some cases, a CNV can be inherited from both parents). A de novo CNV spontaneously arises in an individual and is not transmitted from either parent, and there is considerable interest in the importance of de novo CNVs as a significant genetic cause for ASDs, especially in simplex families. However, both maternally-inherited and paternally-inherited CNVs are also believed to confer varying degrees of pathogenic risk. If the origin of a CNV has not been ascertained, then its inheritance is classified in the module as "Unknown".
Family Profile. In many cases, families with autistic individuals are frequently categorized as either simplex or mulitplex. In a simplex family, the proband identified in a CNV report is the only sibling in the proband's family with ASD. Simplex cases may also be referred to as sporadic cases in the scientific literature. In a multiplex family, in addition to the proband identified in a CNV report, there is at least one additional autistic sibling in the proband's family. When such information is provided, the Family Profile is listed as either Simplex or Multiplex. This information is essential in understanding how closely a given CNV co-segregates with disease.
CNV-Disease Segregation. Of particular importance in assessing the clinical importance of any given copy number variant is how closely the CNV associates or segregates with the disease. For example, if a copy number variant is only identified in one or more autistic siblings, but it is not present in any unaffected siblings, the CNV is said to be segregated with the disease. However, if a copy number variant is found both in an autistic individual and at least one of his or her unaffected siblings, or if a CNV is present in one autistic sibling but not in another affected sibling, then the CNV-disease association is characterized as not segregated. By their nature, de novo CNVs are considered to closely segregate with disease.
CNV-2) How do I enter the CNV database?
There are three ways to access the CNV database (Figure CNV-1):

Figure CNV-1. Entrance into the CNV database can be done by (1) clicking on “explore copy number variants”, which will display all CNV loci in the database; (2) clicking on a particular chromosome of interest (in this instance, chromosome 15) in the ideogram, which will result in a display showing all CNV loci on chromosome 15; or (3) using the “Advanced Search” functionality in the “Tools” box.
- To view all of the CNV loci in the database, click on “Explore Copy Number Variants” in the upper right corner of the chromosomal ideogram on the CNV Module Home Page.
- To view only those CNV loci on a specific chromosome, click on the chromosome of interest in the chromosomal ideogram on the CNV Module Home Page.
- Use the “Advanced Search” function in the “Tools” bar on the left side of the page. Then, select “CNV” from the “Select a Dataset” menu at the top of the page. Then, select either “Chromosome #” of “CNV Locus” to search for CNV loci of interest. For example, let’s say you were interested in all CNVs in the database in the 2p16 region. Select “CNV Locus”, type “2p16”, and hit “submit query” (Figure CNV-2a). The resulting table will contain all CNV loci that reside within the 2p16 region (Figure CNV-2b).
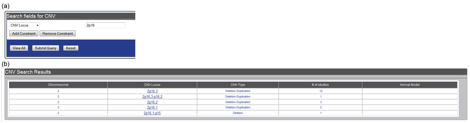
Figure CNV-2. Using the CNV module search engine to find CNV loci of interest. (a) To search for CNV loci within the 2p16 region, select “CNV Locus”, type “2p16”, and hit “submit query”. (b) The search results for the “2p16” query will list all CNV loci in the database that lie within the selected region.
CNV-3) What do I see in the search result for the CNV module?
The search result for the CNV module, such as that shown in Figure CNV-3 that shows the search results for chromosome 15, consists of a table with columns for Chromosome, CNV locus, CNV Type, # of studies, and Animal Model. If there is an animal model for a CNV locus in the database, a mouse icon will appear in the Animal Model column for that CNV locus.
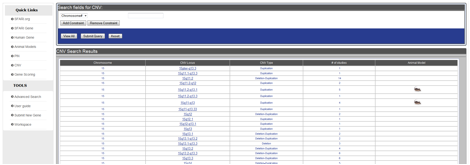
Figure CNV-3. The search results for the CNV module consists of a table showing chromosome, CNV locus, CNV Type, # of studies, and Animal Model. For those CNV loci with a corresponding animal model, such as the 15q11.2-q13.1 and 15q11-q13 loci, there is a mouse icon in the Animal Model column.
CNV-4) How do I view the detailed annotation of a CNV locus?
To view the detailed annotation of a CNV locus, click on the name of the CNV locus. This will take you to the detailed annotation display for the selected CNV locus.
CNV-5) What do I see in the detailed annotation of a CNV locus?
The detailed annotation of a CNV locus is presented in a tab-based display format with tabs entitled “CNV Summary”, “Population Data”, “Individual Data”, and “Animal Model”; the contents of each of these tabs is described in greater detail.
CNV-6) What do I see in the CNV Summary tab?
The CNV summary tab contains the following content: Summary Information, which summarizes the relevance of CNVs at a particular locus to ASD; Additional Locus Information, which employs an expand/collapse functionality and provides links to the UCSC and NCBI Genome Browsers and the DECIPHER website (in those cases where there is a corresponding disease- or syndrome-associated microdeletion and/or microduplication in the DECIPHER database); and References, which are divided into major and minor reports via an expand/collapse functionality (Figure CNV-4).
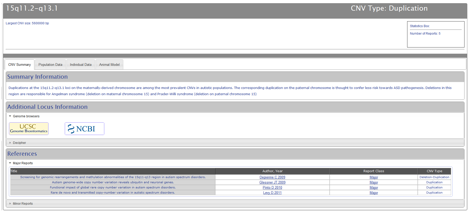
Figure CNV-4. The CNV Summary tab contains sections for summary information, additional locus information, and references. The summary information section contains a brief summary of the relevance of CNVs at the locus of interest in ASD. The additional locus information section provides links to additional resources with additional information on the genetic composition of the CNV, such as the UCSC and NCBI genome browsers, and on corresponding disorders or syndrome in the DECIPHER database. The references section divides major and minor CNV reports via an expand/collapse functionality.
CNV-7) What do I see in the Population Data tab?
As shown in Figures CNV-5 and CNV-6, the Population Data tab employs an expand/collapse functionality to separately display population case and control data and divides annotated population data between “Summary” and “Additional” tabs. The “Summary” tab of a CNV locus Population Data table (Figure CNV-5) shows the following information: Cohort ID; the first author & year of publication of the CNV report that featured the cohort in question; a brief description of the cohort; the size of the cohort; the diagnosis of the cohort; the age and gender of the cohort; the size of the largest CNV at the locus of interest found in a given report; and the number of deletions, duplications, and total CNVs at the locus of interest in a given report. The “Additional” tab (Figure CNV-6) shows the following information: Cohort ID; the geographical ancestry of the cohort; the discovery methodology, platform, algorithm and software used to identify CNVs; and the validation method used to confirm the CNVs, if applicable.
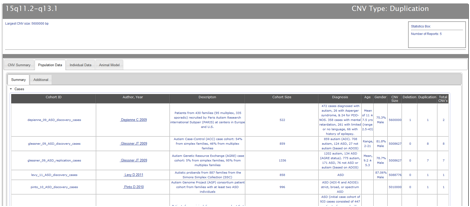
Figure CNV-5. The Summary tab of the Population Data display.

Figure CNV-6. The Additional Tab of the Population Data display.
CNV-8) What do I see in the Individual Data tab?
As shown in Figures CNV-7 and CNV-8, the Individual Data tab employs an expand/collapse functionality to separately display individual case and control data and divides annotated individual data between “Summary” and “Additional” tabs. The “Summary” tab of a CNV locus Individual Data table (Figure CNV-7) shows the following information: Patient ID; the first author and year of publication of the CNV report that featured the individual in question; the age and gender of the individual; the primary diagnosis, clinical profile, and cognitive profile of the individual; the start and end coordinates, the size, and the type of CNV at the locus of interest in the individual; the genome build used to determine the coordinates of the CNV, and whether or not the CNV was validated by an independent secondary methodology following its discovery. Data in the Individual Data table is presented based on the size of the CNV within the locus of interest, from largest CNV to smallest CNV. The “Additional” tab (Figure CNV-8) shows the following information: Patient ID; a description of the validation methodology; the primary disorder inheritance; the mechanism of CNV inheritance; the family profile of the individual; the extent to which the CNV at the locus of interest segregates with disease in the individual; the gene content of the CNV; and altered gene expression.

Figure CNV-7. The Summary tab of the Individual Data display.

Figure CNV-8. The Additional tab of the Individual Data display.
CNV-9) What do I see in the Animal Model tab?
For those CNV loci for which there is a corresponding animal model, the animal model tab show a tab-based data display with tabs for “Model Summary”, “Construct Details”, and “Phenotypic Profile” (Figure CNV-9). The “Model Summary” tab includes mouse chromosome information, model summary, external links to the UCSC and NCBI Genome Browsers, an external link to the Mouse Genome Informatics website, and a table of references, with the first report in which the animal model was studied listed as the “Primary” report.
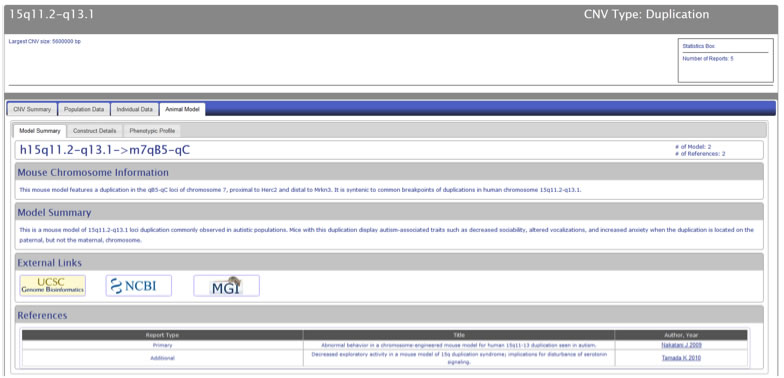
Figure CNV-9.For those CNV loci with a corresponding animal model, the animal model tab will show a tab-based display. The "Model Summary" tab includes mouse chromosome information, model summary, external links to the UCSC and NCBI Genome Browsers, an external link to the Mouse Genome Informatics website, and a table of references, with the first report in which the animal model was studied listed as the "Primary" report.
The “Construct Details” tab includes a list of models of the CNV locus along with construct information for those models (Figure CNV-10).

Figure CNV-10. The “Construct Details” tab contains information on the model type, the model genotype, a definition of the construct, and the synteny of the mouse model to its human counterpart.
The “Phenotypic Profile” tab includes detailed phenotypic information for all the models of a particular CNV locus (Figure CNV-11). The phenotypic information is displayed using an entity-quantity (EQ) classification system, which describes the phenotype using standardized vocabulary.
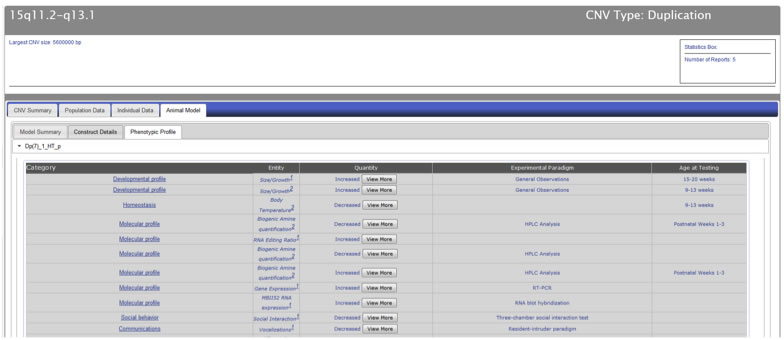
Figure CNV-11. The “Phenotypic Profile” tab contains phenotypic information presented in an entity-quantity (EQ) format.
CNV loci that do not have a corresponding animal model will show “No animal model currently available”.
CNV-10) How do I view documentation about the curation of data within the CNV module?
To view documentation about the curation of data within the CNV module, select the “Curation” sub-navigation tab on the CNV module Home Page.
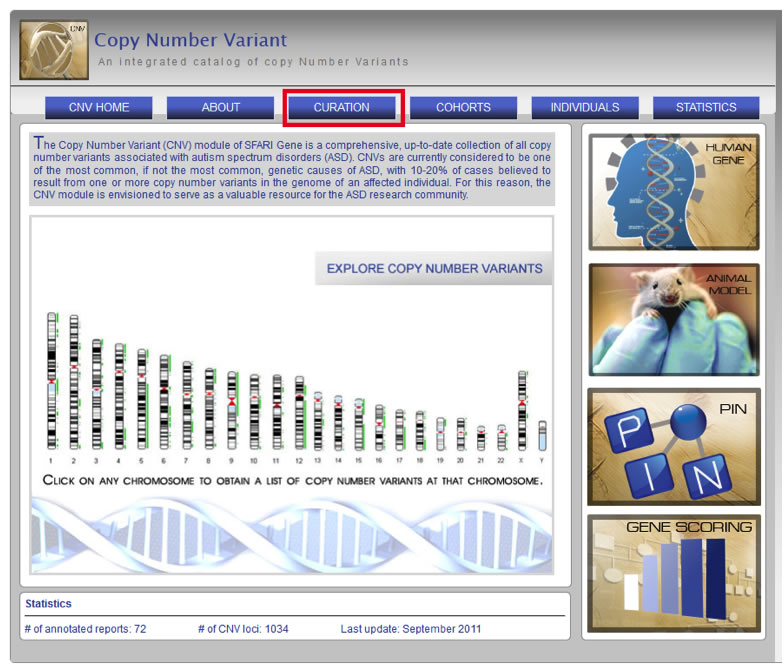
Figure CNV-12. Curation documentation can be viewed by selecting the “Curation” sub-navigation tab, highlighted here in red, on the CNV module Home Page.
CNV-11) How do I view current statistics for data within the CNV module?
To view current statistics for data within the CNV module, select the “Statistics” sub-navigation tab on the CNV module Home Page.

Figure CNV-13. Current statistics for the data within the CNV module can be viewed by selected the "Statistics" sub-navigation tab, highlighted here in red, on the CNV module Home Page.
WS -1) What is WorkSpace?
Workspace is a feature of AutDB 2.0 that allows registered users to input the most up-to-date information into the AutDB database.
WS-2) How do I access Workspace?
NOTE: Registration with AutDB is required to access the Workspace feature of AutDB. All Workspace actions will be associated with your user id.
You can access Workspace by clicking on the link in the left-hand menu of the AutDB Search page. The control panel for Workspace is shown in Figure WS-1.

Figure WS-1. Control panel for Workspace functionalities. All Workspace functionalities are accessible from the control panel. You can analyze gene sets into three potential Workspaces by downloading them from AutDB and/or uploading your own files from your desktop. You can also merge your gene sets with the reference set and view multiple Workspaces
WS-3) How do I upload a file into Workspace?
On the top right side of the Control Panel, you should see a box titled “Upload a dataset using a delimited file format,” as shown in Figure WS-2. Click on the “Browse” button to select files from your own computer. Once the file source is entered into the box, click the “Send file for Validation” button.
IMPORTANT: Only tab-delimited files are accepted. An Excel spreadsheet needs to be saved in tab-delimited format. To do this, save as “Other Formats” à “Text (tab delimited).” Word documents will not be accepted. Clicking on the sample file link will provide exact definitions of the 8-column headers for file upload. The column headers include:
(1) GENE_SYMBOL;
(2)GENE_ENT_GENE_ID;
(3)GENE_NAME;
(4)GENE_CHR_NUM;
(5)GENE_CANDIDATE_TYPE;
(6)GENE_ASSOCIATION_EVIDENCE_SIG; p;
(7)GENE_ASSOCIATION_NUM_STD;
(8)GENE_PRI_AUT_REF.
It is possible to upload a file without data in all the columns. However, an empty cell should have “N/A.”
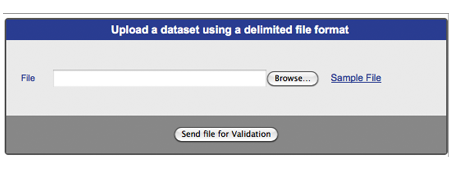
Figure WS-2 Uploading a dataset into Workspace.
You will be notified upon successful validation of the gene set, as shown in Figure WS-3. You should name the uploaded gene set, assign it to Workspace 1, 2, or 3, and click the “Save” button.

Figure WS-3. Successful validation of an uploaded gene set.

Figure WS-4. Selecting your uploaded gene set for viewing.
Next, you should select the dataset (Mygeneset) in Workspace 2, as shown in Figure WS-4. You can view the content of the uploaded file by clicking the “View” button.
Contents of the gene set will appear in a new window, designated by Workspace#/file name, as shown in Figure WS-5.

Figure WS-5. Viewing your uploaded gene set.
WS-4) How do I download a reference file from the AutDB 2.0?
On the top left-hand side of the Control Panel for Workspace (Figure WS-1), there is a box titled “AutDB Dataset Selection Download.” From the “Select a Category” drop-down menu, you may choose from the entire AutDB dataset (All Gene) or select specific gene sets such as Rare, Syndromic, Association, Functional, or Others. You must then choose a name for this file, assign it to Workspace 1, 2, or 3 and click the “Save” button (Figure WS-6).

Figure WS-6. Downloading a Reference Dataset. In this example, a dataset of all rare single gene mutations linked to autism is being downloaded into Workspace 1 with a user-provided file name of myrare_may3.
You will be notified when the gene has been successfully entered into the assigned Workspace, as shown in Figure WS-7. To view the newly created Workspace, click on the left-hand link “Click here to view the data.”

Figure WS-7. Successful downloading of a gene set into an assigned Workspace.
You should then select the dataset you want to view, along with desired fields of the dataset. Once your selections are made, click the “View” button at the bottom, as shown in Figure WS-8.

Figure WS-8. Selecting a downloaded dataset for viewing.
Contents of the gene set will appear in a new window, designated by Workspace#/file name (Figure WS-9).

Figure WS-9. Viewing the contents of a downloaded dataset.
WS-5) How do I merge data between various files and Workspaces?
In the middle of the Control Panel, there is a box titled “Dataset Operations.” Select the Workspaces and file names for the gene sets you want to merge. In Figure 20, the file “Refset” in Workspace 1 and file “Mygeneset” in Workspace 2 are selected for merging.
Next, select the operation “Merge Data” (second row). Designate a name for the merged file (mergenow is the file name in the example in Figure WS-10). Finally, assign the merged file to Workspace 1, 2, or 3, and click the “Run Operation” button.

Figure WS-10. Selecting Workspaces and files for merging.
You will be notified when the gene sets have merged successfully (Figure WS-11).

Figure WS-11. Successful merging of gene sets.
Next, select the merged file, along with desired fields of the dataset. Then click the “View” button at the bottom (Figure WS-22).

Figure WS-12. Selecting a merged file for viewing.
Contents of the gene set will appear in a new window, designated by Workspace#/file name (Figure WS-13).

Figure WS-13. Viewing the contents of a merged file.
WS-6) After all of the desired information input, how do I actually utilize Workspaces and information from the files?
You can view a particular Workspace by selecting one of the Workspace tabs in the bottom right-hand corner of the control panel. Links back to the control panel and to the other workspaces are located at the top left-hand and right-hand sides of the page, respectively.
The main heading of the Workspace will list all of the uploaded files as designated by the user-created filenames. You can delete any undesired datasets. Towards the bottom of the Workspace, you’ll see a series of options for viewing information from the dataset. You must first select the filename to view and then choose one of three viewing options: “Summary,” which provides an overview of all of the genes and data information in the gene set; “Selection,” which allows you to view a specified part of the dataset, based on a variety of filtering options; or “All,” which allows you to view the entire uploaded file.
Cit-1) How do I cite the content of AutDB 2.0?
AutDB: a gene reference resource for autism research.
Basu SN, Kollu R, Banerjee-Basu S.
Nucleic Acids Res. 2009 Jan;37(Database issue):D832-6. Epub 2008 Nov 10.
![]()
PMID: 19015121
AutDB 2.0 User Guide: December 2011
This document is designed to acquaint the new user with AutDB release 2.0, an integrated resource for autism research, and to provide enough information to allow the user to search and view results from the database.
This user guide features step-by-step instructions for using the AutDB modules Human Gene and Animal Model, as well as our new Workspace tool. It also provides instructions for citing AutDB. You can access each of these topics by using the tabs on the left-hand menu.
You can open a pdf version of this guide to read alongside your work in the AutDB window. To access the pdf version, click on the button located in the left-hand menu.
Please contact us with any comments or questions. We hope you enjoy using AutDB, and we encourage you to edit/add to its modules with any of your published data.
Getting Started
Welcome to AutDB!
We hope that you benefit from this publicly available, curated, web-based, searchable database for autism research. AutDB contains interactive modules linking information about risk genes for autism with corresponding data from animal models and more.
- GS-1) What is AutDB?
- GS-2) What are the new features of AutDB 2.0?
- GS-3) What types of information does AutDB 2.0 contain?
- GS-4) What is the gene classification rationale in AutDB 2.0?
- GS-5) How is AutDB 2.0 data organized?
- GS-6) How do I access data within AutDB 2.0?
- GS-7) How do I search AutDB 2.0 using Advanced Search?
Human Gene Module
The Human Gene module contains an active collection of genes implicated in autism. These include candidate genes identified in genetic association studies, genes linked to syndromic autism, and rare single gene mutations. The last group is the most rapidly expanding group of genes. You’ll find step-by-step instructions for searching and editing the Human Gene module below.
- HG-1) What information does the Human Gene module contain?
- HG-2) What new features of the Human Gene module are present in AutDB 2.0?
- HG-3) How do I enter the Human Gene database?
- HG-4) What do I see in the search result for the Human Gene module?
- HG-5) How do I view the detailed annotation of a candidate gene?
- HG-6) What do I see in the detailed annotation of candidate genes?
- HG-7) What do I see in the Summary tab of candidate genes?
- HG-8) What do I see in the Sequence Variants tab of candidate genes?
- HG-9) How is data within the Human Gene module linked to other modules of AutDB 2.0?
- HG-10) How do I edit/submit annotations to the Human Gene module?
- HG-11) How do I view documentation about the curation of data within the Human Gene module?
- HG-12) How do I view current statistics for data within the Human Gene module?
Animal Model Module
The Animal Model module includes details on the behavioral and anatomical characteristics of animal models of autism. It is organized using a dataset called PhenoBase. Youll find step-by-step instructions for searching the Animal Model below.
- AM-1) What's New in Animal Model Module V2.0?
- AM-2) How do I view Animal Model module data?
- AM-3) How do I search data within the Animal Model module?
- AM-4) What do I see in the search result for the Animal Model module using Advanced Search?
- AM-5) What do I see in the detailed annotation of genetic animal models in AutDB?
- AM-6) What do I see in the detailed annotation of induced animal models in AutDB?
- AM-7) What do I see in the summary tab of genetic animal models in AutDB?
- AM-8) What do I see in the construct details tab of genetic animal models in AutDB?
- AM-9) What do I see in the phenotypic profile tab of genetic animal models in AutDB?
- AM-10) What do I see in the inducer summary tab of induced animal models in AutDB?
- AM-11) What do I see in the construct details tab of induced animal models in AutDB?
- AM-12) What do I see in the phenotypic profile tab of induced animal models in AutDB?
- AM-13) What is PhenoBase?
PIN
The Protein Interaction (PIN) module serves as a comprehensive, up-to-date reference for all known molecular interactions of gene products associated with autism spectrum disorders (ASD). This PIN module is envisioned to have immediate application for network biology analysis of molecular pathways involved in ASD pathogenesis. Step-by-step instructions for searching the PIN module are located below.
- PIN-1) What information does the PIN module contain?
- PIN-2) What new features of the PIN module are present in AutDB 2.0?
- PIN-3) How do I enter the PIN database?
- PIN-4) What do I see in the search result for the PIN module?
- PIN-5) How do I view detailed annotation for protein interactions?
- PIN-6) What do I see in the detailed annotation of protein interactions?
- PIN-7) What do I see in the Interactome tab of protein interactions?
- PIN-8) What do I see in the Interaction Table tab of protein interactions?
- PIN-9) How do I view documentation about the data curated within the PIN module?
- PIN-10) How do I view current statistics for data within the PIN module?
CNV
The Copy Number Variant (CNV) module of AutDB is a comprehensive, up-to-date collection of all copy number variants associated with autism spectrum disorders (ASD). CNVs are currently considered to be one of the most common, if not the most common, genetic causes of ASD, with 10-20% of cases believed to result from one or more copy number variants in the genome of an affected individual. For this reason, the CNV module is envisioned to serve as a valuable resource for the ASD research community.
- CNV-1) What information does the CNV module contain?
- CNV-2) How do I enter the CNV database?
- CNV-3) What do I see in the search result for the CNV module?
- CNV-4) How do I view the detailed annotation of a CNV locus?
- CNV-5) What do I see in the detailed annotation of a CNV locus?
- CNV-6) What do I see in the CNV Summary tab?
- CNV-7) What do I see in the Population Data tab?
- CNV-8) What do I see in the Individual Data tab?
- CNV-9) What do I see in the Animal Model tab?
- CNV-10) How do I view documentation about the curation of data within the CNV module?
- CNV-11) How do I view current statistics for data within the CNV module?
Workspace
Workspace is a new interactive feature of AutDB. It provides a simulated environment in which a reference gene set from AutDB can be used along with the user's gene(s) for analysis without requiring the user to enter the latter into the database.
- WS -1) What is WorkSpace?
- WS-2) How do I access Workspace?
- WS-3) How do I upload a file into Workspace?
- WS-4) How do I download a reference file from the AutDB 2.0?
- WS-5) How do I merge data between various files and Workspaces?
- WS-6) After all of the desired information input, how do I actually utilize Workspaces and information from the files?
Citations
|
|
| HELP Sign In |